Social exposome and brain health outcomes of dementia across Latin America
Participants
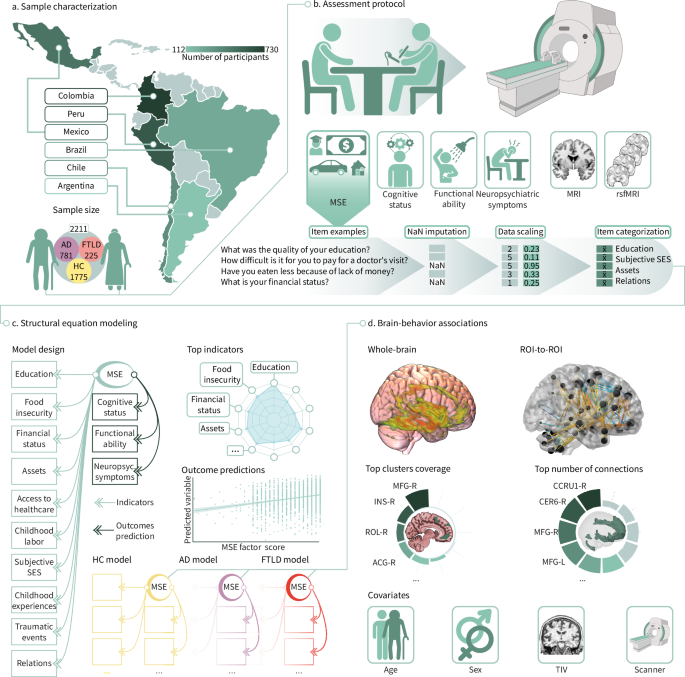
The study included 2211 participants with a mean age of 64.63 years (SD = 11.26), of whom 67.03% were women. Sex information was determined by self-report. The sample was comprised of individuals with probable AD (n = 781), FTLD (n = 255), and HC (n = 1175) (Table 1). Participants were recruited from the Multi-Partner Consortium to Expand Dementia Research in Latin America (ReDLat)51,57, with recruitment conducted across six LA countries: Argentina (n = 112, HC:AD/FTLD = 52:60), Brazil (n = 172, HC:AD/FTLD = 116:56), Chile (n = 200, HC:AD/FTLD = 78:122), Colombia (n = 730, HC:AD/FTLD = 250:480), Mexico (n = 356, HC:AD/FTLD = 227:129), Peru (n = 641, HC:AD/FTLD = 452:189). ReDLat collects data from multiple centers across these countries, using a standardized data framework and harmonized diagnostic protocols7,20,53,58,59. Participants were recruited from extensive networks including (a) clinical networks, involving memory clinics, neurology departments, and affiliated hospitals; (b) academic collaborations, leveraging partnerships with universities and research institutions; (c) community outreach programs, engaging with local communities through informational sessions, and culturally tailored materials to encourage participation from rural and urban populations with diverse socioeconomic backgrounds; and (d) public health initiatives and local organizations, integrating recruitment efforts with public health campaigns and community groups to raise awareness and facilitate participation. These efforts allowed us to include individuals from rural and urban settings, focusing on underrepresented groups, as our ReDLat cohort is marked by socioeconomic inequality14 and educational disparities15. Strategies to improve access and recruitment for these groups involve field screenings, community engagement efforts, and the use of mobile units. No compensation was provided to participants. Exclusion criteria included participants with conditions other than AD or FTLD or those with impairments preventing task completion. Diagnoses were determined by consensus among expert healthcare providers at each site, based on cognitive and neurological exams, clinical interviews, and MRI57. The diagnoses are based on the clinical criteria established by the National Institute of Neurological and Communicative Disorders and Stroke and the Alzheimer’s Disease and Related Disorders Association (NINCDS-ADRDA) for AD, as well as on the clinical criteria specified for FTLD. Healthy Controls had preserved cognition and no history of neurological or psychiatric conditions. A standardized battery was used to capture clinician evaluations. Clinical and cognitive assessments across ReDLat sites were harmonized, normalized, and validated57. ReDLat aligns with current guidelines to increase the representativeness of samples enrolled in Alzheimer’s disease research centers54 by implementing inclusive recruitment strategies and strengthened community engagement, geographic decentralization, and unified inclusion and exclusion criteria. All clinicians underwent training and certification by a specialized team and adhered to a quality control protocol57. The study received approval from the ReDLat consortium through multiple institutional review boards: FWA00028264, FWA00001035, FWA00028864, FWA00001113, FWA00010121, FWA00014416, FWA00008475, FWA00029236, FWA00029089, and FWA00000068. Data collection and analysis presented no risks related to stigmatization, incrimination, discrimination, animal welfare, environmental or health concerns, safety, security or personal privacy. Additionally, no transfer of biological materials, cultural artifacts or traditional knowledge occurred. All participants signed informed consent in accordance with the 2013 Declaration of Helsinki.
MSE assessment
Questionnaire
An expert team designed a questionnaire that reviewed existing tools and their validity data on various social, economic, familial, and environmental factors that can influence health across the lifespan56. This questionnaire was created by different experts working with Latino participants from Mexico, Central America, and South America. It was co-designed by the ReDLat consortium and the UCSF-MAC, following the NIA Health Disparities Research Framework and the Institute of Medicine reports. Matching guidelines to increase sample representativeness in Alzheimer’s disease research54 and recommended practices for cross-national comparisons55, validity testing was performed with a diverse sample of Latino Spanish-speaking participants, clinicians, and researchers to iteratively improve the questionnaire and standardize the collection of sociodemographic factors. Unlike typical questionnaires that focus on single domains, such as education, childhood experiences, or traumatic experiences, this questionnaire aimed to evaluate multiple domains simultaneously to understand how life experiences and conditions from childhood to the present impact health. The questionnaire builds on existing tools like the Protocol for Responding to and Assessing Patient Assets, Risk, and Experiences (PRAPARE) and the Latin American and Caribbean Food Security Scale (ELCSA). Questionnaire construction aligns with current harmonization guidelines60, as (a) items were selected after careful inspection from clinicians and researchers from different cultures (at least one from each country) and comparability across countries; (b) development of psychometric procedures to test if dimension composite score represents a coherent and consistent latent construct of interrelated variables and captures the intended dimension; and (c) transparency and openness by providing the full version of the questionnaire in a repository (https://osf.io/78ng6/).
Validation
The protocol has been standardized, validated, and subjected to psychometric standardization samples from different countries, including healthy individuals and those with neurocognitive disorders, ensuring its applicability to diverse populations56,61. The questionnaire was administered to 137 participant-caregiver dyads in a more detailed validation. After multivariate assumptions such as normality, linearity, homogeneity, and homoscedasticity, adequacy tests were conducted to ensure data quality (Bartlett’s test of sphericity: χ2 = 2191.611, p < 0.001; Kaiser–Meyer–Olkin measure: MSA = 0.75). Lastly, a three-factor SEM was created, including SES, challenging life experiences, and educational environment, which showed good fit indices (TLI = 0.764, RMSEA = 0.062, SRMR = 0.06, CFI = 0.884)56. We reviewed the questionnaire to remove items that might create circular associations with dementia-related outcomes. We excluded dimensions that could be directly influenced by dementia symptoms, thereby risking the measurement of those symptoms instead of the intended MSE construct. Specifically, we removed items related to technology access (smartphone use), employment status (work engagement), and income sources (current salary) (Supplementary Information 5).
Dimensions
The MSE questionnaire systematically evaluates a comprehensive range of topics to ensure a thorough assessment of the participant’s background and experiences.
Education is evaluated through the number of years of formal education, the type of school attended (public or private), the geographical location of the school (rural or urban), and the overall quality of education received (from very bad to excellent), number of books at home during the first 10 years of life (from 0 to more than 200), and the educational achievement of the mother and father (from none to doctoral degree).
Food insecurity captures if the participant had to eat less (yes/no) or less healthy (yes/no) due to economic hardship across the lifespan (from 0 to 10, 35 to 45 years old, and recently), capturing the quality and consistency of food insecurity experienced by the participant across the lifespan.
Financial status assesses the participant’s financial stability and ability to meet basic needs over different periods of their life (from 0 to 10, 35 to 45 years old, and recently). It measures the difficulty in covering basic needs, the sufficiency of income at the end of the month, the diversity of income sources, and the proportion of income spent on housing. Additionally, it gauges the participant’s financial resilience in the event of lost income and health insurance (public, private, or none), offering a comprehensive view of their economic situation and security throughout their lifespan.
Assets evaluate the participant’s access to essential household utilities and goods over different periods (from 0 to 10, 35 to 45 years old, and recently). It assesses whether the participant had access to electricity, radio, television, refrigerator, washing machine, landline telephone, water heater, indoor bathroom, running water, automobile, computer, internet, sound system, smartphone, and private room. Additionally, it measures the quantity of certain items like televisions, bathrooms, cars, computers, and private rooms the participant had during these periods. This assessment provides a detailed view of the participant’s material living conditions and how they have evolved throughout their lifespan.
Access to healthcare assesses the participant’s difficulty in affording medical care across different life stages (from 0 to 10, 35 to 45 years old, and recently). It evaluates whether the participant experienced difficulty paying for medical services and explores specific barriers that may have prevented them from seeing a doctor (from not hard to very hard). These barriers include financial constraints, appointment availability, transportation issues, distance, lack of accompaniment, the COVID-19 pandemic, or socio-political events (yes/no). This assessment provides insights into the participant’s access to healthcare and the factors influencing it throughout their lifespan.
Childhood labor investigates whether the participant worked before the age of 18 (yes/no) and the specific age range during which they started working (from 5 to 18 years old). It also delves into the reasons for working at a young age, including whether to meet personal needs, support family needs, save money, or learn a new skill (yes/no). This assessment provides insight into the participants’ early exposure to work and the SES factors that may have influenced their decision to work during childhood or adolescence.
Subjective SES is evaluated by asking participants to reflect on their family’s ability to meet basic needs and their financial situation from 0 to 10, 35 to 45 years old, and recently (from level 0 to 10).
Childhood experiences comprise the participant’s early childhood environment, focusing on family structure, emotional support, and potential adverse experiences. It includes questions about the number of children in the household during the first 10 years, whether the participant had to leave school to support the household (yes/no), and the frequency of feeling loved by parents and receiving physical affection. Additionally, it explores conflicts within the family, such as fights between parents, parents-participant, and siblings. The questions also inquire about exposure to alcohol abuse, the organization of the household, and experiences of neglect during childhood (from never to frequently). This assessment provides a comprehensive view of the participant’s early family life and its potential impact on their development.
Traumatic events evaluate the participant’s exposure to traumatic events, violence, and maltreatment from 0 to 10, 11 to 24, 25 to 34, 35 to 45, 46 to 65 years old, less than a year, and recently. It includes questions about the loss of siblings or children before the age of 18, experiences of political violence and repression, and exposure to theft or robbery both inside and outside the home. It also examines the participants’ involvement in or witness to accidents, situations where they feared for their lives, and encounters with dead or injured individuals. Furthermore, the questions explore experiences of physical violence, being attacked with a weapon, humiliation, restrictions on personal freedom, neglect, and financial control. Additionally, the set assesses instances where the participant was pressured to leave their property or coerced into sexual activity (yes/no). These experiences are considered in relation to different individuals (family members, friends, caregivers, strangers) (yes/no). This comprehensive assessment aims to capture the depth and breadth of the participant’s exposure to adverse and potentially traumatic experiences throughout their life.
Relationships assess the participant’s frequency of contact with loved ones and experiences of being treated with less respect across different stages of life and in recent times. It measures how often the participant interacts with close family or friends, ranging from less than once a week to more than five times a week. Additionally, it explores the frequency of disrespect or mistreatment experienced during various life stages (0 to 10, 11 to 24, 25 to 34, 35 to 45, 46 to 65 years old, less than a year, and recently). These experiences are categorized by how often they occur, ranging from almost daily to less than once a year or never. This assessment provides insights into the participant’s social connections and the prevalence of negative interpersonal experiences throughout their life.
Scoring
The questionnaire employs various response formats, including Likert scales, multiple-choice questions (Yes/No), and free text fields. Privacy is prioritized, with the most sensitive questions, such as those about experiences of violence, abuse, and discrimination, answered individually by the participant (without the presence of the caregiver). Following previous reports62, we scored the questionnaire by creating composite variables by grouping items based on expert consensus on the similarity of the assessed domains. After excluding items (Supplementary Information 5), each variable was min–max scaled between 0 and 1, with 0 and 1 indicating lower and higher levels of adversity of social exposome. Then, the dimension scores for each participant were obtained by averaging the value of the total number of variables per category (education, food insecurity, financial status, assets, access to healthcare, childhood labor, subjective SES, childhood experiences, traumatic events, and relations) to produce a score between 0 and 1. These values for each domain were used as inputs in the SEM. Confirmatory factor analyses showed a good model fit for the dimensions (Supplementary Table 13). These results indicate that the dimension composite scores accurately represent the latent construct and consistently capture the intended dimensions.
Cognition, functional ability, and neuropsychiatric symptoms
The mini-mental state examination (MMSE) is a widely used cognitive screening tool that evaluates various cognitive functions, including arithmetic, memory, and orientation. It assesses five key domains: orientation, registration, attention and calculation, recall, and language. The MMSE is scored from 0 to 30, with higher scores indicating better cognitive function. A score of 24 or above is considered normal, while scores below 24 suggest cognitive impairment. Specifically, scores between 19 and 23 indicate mild cognitive impairment, scores between 10 and 18 indicate moderate cognitive impairment, and scores below 10 suggest severe cognitive impairment. The MMSE has demonstrated moderate to high reliability and is frequently used across LA populations.
The Pfeffer Functional Activities Questionnaire (PFAQ) is a tool designed to assess the functional ability of older adults, focusing on instrumental activities of daily living. The PFAQ evaluates the capacity to perform activities such as using the telephone, managing finances, preparing meals, and managing medications. Scoring of the PFAQ ranges from 0 to 30, with higher scores indicating greater levels of dependence or functional impairment. Each item is rated on a scale from 0 (independent) to 3 (dependent), and the total score provides an overview of the individual’s functional status. The PFAQ is reliable and employed in studies involving LA populations.
The Neuropsychiatric Inventory Questionnaire (NPI-Q) is a streamlined version of the original Neuropsychiatric Inventory (NPI), designed to assess a wide range of neuropsychiatric symptoms commonly found in patients with dementia. The NPI-Q evaluates 12 key domains: delusions, hallucinations, agitation/aggression, depression/dysphoria, anxiety, euphoria/elation, apathy/indifference, disinhibition, irritability/lability, aberrant motor behavior, nighttime behavioral disturbances, and appetite/eating abnormalities. Scoring of the NPI-Q ranges from 0 to 36, with two components for each domain: the frequency and severity of symptoms. Frequency is rated from 1 (occasionally) to 4 (very frequently), and severity is rated from 1 (mild) to 3 (severe). The total score sums these ratings across all domains, providing a comprehensive measure of the patient’s neuropsychiatric profile. Higher scores indicate more severe and frequent symptoms. The NPI-Q has adequate test-retest reliability and convergent validity and is commonly applied in research involving LA populations.
Scores of functional ability and neuropsychiatric symptoms were inverted to facilitate the interpretability of the associations in the same direction as cognitive scores. The higher the value, the higher the functional capacity and the lower the neuropsychiatric symptoms.
Neuroimaging acquisition and preprocessing
MRI preprocessing
3D T1-weighted images were collected for 875 individuals with a mean age of 65.13 years (SD = 10.77), of whom 65.94% were women. Sex information was determined by self-report. 310 individuals with AD, 123 with FTLD, and 442 HC were included (Argentina [n = 84, HC:AD/FTLD = 38:46], Brazil [n = 92, HC:AD/FTLD = 69:23], Chile [n = 137, HC:AD/FTLD = 53:84], Colombia [n = 203, HC:AD/FTLD = 25:178], Mexico [n = 53, HC:AD/FTLD = 29:24], Peru [n = 306, HC:AD/FTLD = 228:78], Supplementary Table 14). Preprocessing and analysis were employed using VBM with the Computational Anatomy (CAT12) toolbox and in Statistical Parametric Mapping software (SPM 12; Wellcome Center for Human Neuroimaging; www.fil.ion.ucl.ac.uk/spm/software/spm12/) in Matlab R2021a. The standard pipeline included bias-field correction, noise reduction, skull stripping, segmentation, and normalization to the Montreal Neurological Institute (MNI) space at a 1.5 mm isotropic resolution. CAT12 also performed intra-subject harmonization by normalizing data to the mean global intensity for each subject, followed by smoothing gray matter images with a 6 × 6 × 6 mm Gaussian kernel. The homogeneity and orthogonality of the images were verified. Scanner effects were controlled through two approaches: by including scanner type as a covariate in the VBM regression models and standardizing between the minimum and maximum intensity values of each voxel for all subjects evaluated by each scanner type2.
Resting-state fMRI preprocessing
Resting-state sequences were collected for 500 individuals with a mean age of 65.27 years (SD = 12.02), of whom 61.80% were women. Sex information was determined by self-report. 232 individuals with AD, 85 with FTLD, and 183 HC were included (Argentina [n = 51, HC:AD/FTLD = 27:24], Brazil [n = 86, HC:AD/FTLD = 65:21], Chile [n = 127, HC:AD/FTLD = 47:80], Colombia [n = 202, HC:AD/FTLD = 24:178], Mexico [n = 34, HC:AD/FTLD = 20:14], Supplementary Table 15). Image preprocessing was employed using the fmriprep (version 22.0.2) standard pipeline, encompassing head motion artifacts, slice timing, susceptibility distortion correction, co-registration to the anatomical image, and normalization to standard space, with additional steps in the CONN22.a toolbox63. This involved smoothing with a 6 × 6 × 6 mm Gaussian kernel and denoising through linear regression with nine nuisance regressors applied in a single step: six motion parameters (translation and rotation), white matter, cerebrospinal fluid signals, and scrubbing regressors for high-motion time points, and applying a band-pass filter (0.008-0.09 Hz. A motion correction technique was applied by rigidly aligning fMRI volumes to T1-weighted images, ensuring that the impact of motion artifacts was minimized. Motion scrubbing was then applied using framewise displacement >0.2 mm and temporal derivative variance across apace> 5%, which are stricter than conventional thresholds, to flag and remove high-motion frames. The mean proportion of artifact-free to rejected frames was 0.915 (SD = 0.126), with values ranging from 30% to 100%. This was implemented using the artifact detection tools within the CONN toolbox63, using a conservative setting (FD = 0.2 mm, global signal Z = 5) to remove motion artifacts while preserving the biological signal. Pearson correlation coefficients were computed between the average BOLD time series of each pair of regions of interest (ROIs) from the Brainnetome atlas, a structural and functional connectivity-based parcellation atlas that captures both cortical and subcortical regions, better suited to functional connectivity analysis. AAL atlas cerebellar regions were added, generating a total of 272 × 272 ROIs correlation matrix for each participant. These correlation matrices were Fisher z-transformed to normalize the distribution of the correlation coefficients. Scanner variability was controlled by including scanner type as a covariate in the ROI-to-ROI connectivity regression models.
Statistical analyses
Structural equation model
SEM is a statistical method that facilitates the examination of relationships among observed and latent variables, particularly useful for measuring the effect of each indicator and its cumulative effect through a latent variable by integrating aspects of regression analysis, factor analysis, and simultaneous equation models64. The model’s structure was based on ten composite variables derived from the MSE questionnaire, which included education, food insecurity, financial status, assets, access to healthcare (randomly set as the fixed indicator to identify the values for the latent factor), childhood labor, subjective SES, childhood experiences, traumatic events, and relationships. These variables served as indicators of a single MSE latent variable, which was used to predict cognition, functional ability, and neuropsychiatric symptoms. The functional ability and neuropsychiatric symptoms scores were inverted to align their interpretation with other measures. Covariances between variables were theoretically guided by the top modification index score. Model fit was assessed using the fit indices comparative fit index (CFI ≥ 0.9), Tucker–Lewis index (TLI ≥ 0.9), root mean square error of approximation (RMSEA ≤ 0.08), and standardized root mean square residual (SRMR ≤ 0.08). We did not consider χ2 based on its high sensitivity to sample size; as the sample size increases, χ2 values rise, resulting in lower p-values, thus skewing the interpretation of the model’s fit.
Separate models were run for each group to examine the specific associations with cognition, functional ability, and neuropsychiatric symptoms. In addition to testing group-specific effects, this approach allows us to isolate the effects within each group. This approach abolishes the confounding factors observed in group comparisons due to age and sex differences. The value of the MSE latent variable for each subject was extracted from these models for subsequent analysis of associations with gray matter and resting-state functional connectivity. Even the smallest sample size (FTLD) met the N ratio of 10:1 for statistical accuracy and power, with 225 participants exceeding the number of estimated parameters (q = 13). Missing data (maximum 19.7%) were imputed across the sample using predictive mean matching through the multivariate imputation by chained equations (MICE) package (3.16.0) in R version 4.3.0. Additional sensitivity analyses were performed to check for bias due to imputation. The main SEM models were run without imputation for the entire sample and each group separately. Results showed consistent associations across all models, indicating that imputation did not introduce bias. (Supplementary Table 16)
Lasso regression
Lasso regression was employed to examine the individual contributions of MSE dimensions while controlling for multicollinearity. This method was chosen for its ability to perform variable selection and regularization, shrinking less relevant coefficients toward zero and effectively excluding them from the model. The standardized beta coefficients from the SEM models linking the global MSE score to cognition, functionality, and neuropsychiatric symptoms were compared to the R2 values from the Lasso models that included individual MSE dimensions via meta-regressions. This comparison assessed the global MSE score’s explanatory power versus individual dimensions, highlighting the benefits of using an aggregate social exposure metric for understanding multidimensional outcomes.
Meta-regression comparing SEM and Lasso regression models
Bootstrap resampling (n = 400) was applied to estimate the standardized beta coefficients for the paths from the MSE factor to each outcome, capturing the effect sizes and their variability across the bootstrap samples. In parallel, Lasso regression was applied to each bootstrap sample to identify the model’s predictive performance using R2, also capturing effect size variability across the bootstrap samples. After obtaining the bootstrap estimates for both SEM and Lasso regression, the results were compared via meta-regressions for each group across outcomes.
Gray matter associations with MSE
We conducted regression analyses using parametric tests to examine the associations between MSE and brain volume in SPM12, with age, sex, total intracranial volume (TIV), and scanner effects (see Supplementary Table 17 for acquisition parameters) included as covariates of no interest. To enhance behavioral variance and statistical power, HC were merged with AD patients to run VBM models for the AD group, and the process was repeated by pairing HC with FTLD patients for the FTLD model. Multiple comparisons were corrected using the TFCE method, applied via the TFCE toolbox ( This method integrates voxel and cluster thresholds, eliminating the need for arbitrary cluster formation thresholds and enhancing sensitivity to both focal and diffuse effects, thus optimizing the balance between the FDR and replicability65. Statistical significance was assessed through 5000 permutations and set at PFDR < 0.05. Extent and height cluster parameters were set to 0.5 and 2, respectively, following standard approaches66. Brain imaging results were visualized using MRIcroGL (v1.2.20220720).
Resting-state functional connectivity associations with MSE
We conducted regression analyses via parametric tests with the MSE score as a predictor of the whole-brain ROI-to-ROI connectivity. The number of connections of each ROI was calculated to assess its contribution to the broader connectivity patterns associated with MSE. Following alternate methods of calculating degree centrality67,68, we considered edges that were positively or negatively weighted and statistically significant (FDR-corrected). These correspond to values different from zero in the t-statistic matrix, reflecting meaningful ROI-to-ROI relationships. These edges were binarized—assigned a value of one—so that each significant, weighted edge contributes a count of 1 to a node’s degree centrality, representing the number of connections each ROI exhibits in relation to MSE. Higher values indicate that a given ROI’s connectivity demonstrates more widespread associations with MSE. As for gray matter associations, age, sex, and scanner effect (see Supplementary Table 18 for acquisition parameters) were included as covariates of no interest, and each patient group was analyzed in tandem with HC. All results were PFDR corrected at the connection level for the size of the ROI-to-ROI matrix for each ROI, as implemented in CONN toolbox63. Visualization was performed using BrainNet Viewer.
Sensitivity analysis
To control for the effect of confounding variables, we ran a separate SEM model for the entire sample that included age and sex as predictors of the latent MSE factor, as well as cognition, functional ability, and neuropsychiatric symptoms. To control for disease-related variables, we ran a model with AD and FTLD participants that included disease severity (Clinical Dementia Rating (CDR) total score and CDR-FTLD scale-modified), age at onset, and years since diagnosis, in addition to age and sex as predictors of MSE, as well as cognition, functional ability, and neuropsychiatric symptoms. Additionally, to examine the potential effect of the FTLD subtype, we implemented a model with FTLD participants, including a binary subtype variable (behavioral variant frontotemporal lobar degeneration vs. any other subtype) as a predictor of MSE, as well as cognition, functional ability, and neuropsychiatric symptoms.
To investigate whether MSE was influenced by data quality of structural and functional MRI, we conducted sensitivity analyses examining the relationships between MSE and spatial signal-to-noise ratio (SNR) for both MRI and fMRI, temporal SNR for fMRI, and head motion parameters for fMRI. To evaluate the quality of MRI and fMRI data, we employed the ODQ metric69. For MRI data, the assessment focused on the signal-to-noise ratio (SNR) across each slice. The SNR was determined by calculating the mean signal of brain voxels and dividing it by the standard deviation of the signal. For fMRI data, the quality evaluation involved segmenting each time series into 20 repetition times (TR) intervals to compute the temporal signal-to-noise ratio (tSNR)70. The tSNR was defined as the mean fMRI signal within each segment divided by its standard deviation. To further test the effect of motion correction, we applied two procedures: rigid realignment of fMRI volumes to T1-weighted images and scrubbing of high-motion frames. Scrubbing was based on framewise displacement >0.2 mm and global signal change >5% (Methods, Neuroimaging Acquisition and Preprocessing). Participants with less than 70% of artifact-free frames were excluded (Supplementary Tables 7-8). Scanner scaling approaches were applied to MRI data to reduce inter-scanner variability2 (Supplementary Tables 9 and 10). The minimum and maximum voxel intensity values were extracted from all subjects belonging to each scanner type, which were then scaled between the minimum and maximum intensity values specific to each scanner type. Then, voxel-based morphometry analyses were replicated with the scaled images. This method accounts for differences in location and scale (e.g., mean and variance) between sites, reducing scanner-related variability. This process helps to minimize the variability introduced by different scanners2,20.
Reporting summary
Further information on research design is available in the Nature Portfolio Reporting Summary linked to this article.
link