
Achieving inclusive healthcare through integrating education and research with AI and personalized curricula

Stanford Data Ocean overview
SDO is designed to achieve three primary objectives: (1) robust data management that enables easy access to diverse multi-omics and wearable data, ranging from fully open access (e.g., COVID19 wearable datasets39,51) to partially restricted (Integrated Personal Omics Profiling project datasets52,53); (2) personalized education through the use of large-scale datasets and LLMs; and (3) cutting-edge research analytics that capitalizes on AI-driven visualization. Additionally, by transforming scientific papers into standalone learning modules—comprising datasets, code, and exercises—SDO accelerates research innovation while promoting reproducibility and collaborative knowledge sharing. To ensure sustainable learner engagement and long-term impact beyond certificate completion, SDO is creating a dynamic, interactive ecosystem that encourages continuous learning and professional growth. Our platform features monthly live seminars and workshops that not only keep learners updated on emerging technical skills but also foster the development of career-ready soft skills and professional networks. Moreover, learners are empowered to raise and discuss current challenges—such as the evolving interpretation of Variants of Unknown Significance (VUS) in genomic data—ensuring that they remain at the forefront of scientific advancements. Through initiatives such as collaboratively authored blog posts critiquing and replicating results of peer-reviewed research, sharing job opportunities on online discussion forums, and opportunities to collaborate on research projects, SDO provides a sustainable environment where learners can actively apply and expand their knowledge in real-world job and research contexts.
The platform achieves scalability by simplifying the initial setup and eliminating the need for extensive technical expertise and infrastructure maintenance. The platform also effectively enhances the learning experience through the integration of containerization and virtual machines, ensuring minimal interruptions during interactive engagement. The microservice architecture and real-time monitoring tools optimize performance and security, adhering to HIPAA standards. The platform also standardizes modules to promote consistency and reproducibility in bioinformatics research, supporting sustainable development in precision medicine. For more details, see Methods.
Comprehensive multi-database platform for integrated biomedical data analysis
SDO provides a multi-database platform designed to handle a wide variety of biomedical data types, including wearables, genomics, epigenomics, microbiome, metabolomics, and proteomics. This data diversity allows researchers to create comprehensive, real-time cohorts by integrating multiple data types, which can be pivotal for precision medicine research and personalized healthcare interventions. Users can seamlessly access and analyze these datasets through an integrated Jupyter notebook environment. The platform supports data from 107 iPOP subjects with 1416 visits in multiple longitudinal studies52,53,54 encompassing RNAseq, lipidomics, microbiome (gut 16 s, nares 16 s), metabolites, cytokine, targeted assays, and clinical test data (8637 datasets total). One hundred seven genome sequences are also available. Additionally, SDO includes publicly available tokenized data (heart rate, step, and sleep) for two COVID-19 studies: an early COVID-19 detection study of 5,300 participants (280 datasets and over 104 million data points)51 and a real time alerting study of 3,318 participants (4246 datasets and over 1.5 billion data points)39. These datasets enable SDO to offer extensive research and educational activities.
Making learning precision medicine accessible
The curriculum, illustrated in Fig. 1 and Supplementary Fig. 2, outlines Fundamental Learning Modules covering foundational concepts such as Ethics, Programming, Statistics, Visualization, Cloud Computing, and Data Analysis (Multi-omics and Wearables), as well as Advanced Learning Modules that cover thematic areas such as Artificial Intelligence (AI) and Machine Learning (ML) techniques and applications in precision medicine. It integrates continuously updated content based on the latest research findings55,56,57,58 and includes interactive educational content using videos, guided Jupyter notebooks59, and exercises to support professional skill development. Supplementary Fig. 2 shows a sample network curriculum on SDO structured around 24 Learn modules divided into six key thematic areas: Ethics, Programming, Statistics and Visualization, Cloud Computing, Data (which includes Multi-omics and Wearables), and AI/ML. Each module functions as an independent unit equipped with various educational artifacts such as videos, interactive notebooks, exams, self-evaluations, and practical exercises. This design is intended to cultivate a thorough understanding and proficient practical skills in each specific domain, ensuring that learners gain both theoretical knowledge and hands-on experience relevant to the field of bioinformatics and AI/ML.

A well-rounded curriculum in personalized medicine education includes networked modules in all relevant disciplines. This sample modular, networked curriculum consists of four major types of modules: (1) Fundamental Learn Module (grouped within a light peach-colored background): training material for understanding fundamental concepts around data (e.g., multi-omics), statistics and visualization (e.g., probabilities and distributions), programming and technology (e.g., cloud computing), and Career Readiness (e.g., communication, project management, and ethics). While each domain is visually differentiated with sub-color blocks, they are all part of the same light peach-colored foundational module group. Career Readiness includes a series of modules and live events designed to equip students with essential professional skills and industry insights, such as effective communication, teamwork, problem-solving, adaptability, and research capabilities including how to design a study, how to write a scholarly article, and how to present a paper. It also covers career-specific skills such as data privacy ethics, project management, and the use of AI tools in real-world scenarios. These modules aim to bridge the gap between academic learning and the demands of the workplace, preparing students for successful careers in bioinformatics and related fields; To ensure learners’ knowledge and skills stay up to date with industry demands in the long-term, we created new courses in AI/ML, and are building courses specialized in diabetes, cancer, and automating bioinformatics tasks with LLMs. The new courses are created in response to learners’ needs and advancements in AI-driven medicine, aiming to extend learners’ knowledge beyond the foundational modules into specialized niches. (2) Advanced Learn Module (purple background): a mix of multiple interdisciplinary concepts built on top of prerequisite fundamental modules (e.g., Processing large Variant Call Format (VCF) files needs the understanding of genetic mutation, basics statistics such as allele frequency, and how to store and process large files on the cloud); and (3) research Module (green background): a combination of advanced and fundamental modules and provide more advanced information around a certain research topic (e.g., a research paper on Advances and prospects for the Human BioMolecular Atlas Program (HuBMAP) needs understanding of the HuBMAP dataset such as germline mutations and how to process large VCF files on the cloud in a secure fashion).
The platform supports individuals with varying educational backgrounds using a modular and networked curriculum, simplifying access without requiring software installations. This curriculum gradually introduces learners to bioinformatics, guiding them from basic concepts to advanced interdisciplinary topics such as biology, computer science, and statistics. This structured approach not only makes the field more accessible to beginners, but also accommodates personalized learning pathways, enhancing module reusability and keeping learners up-to-date with new developments60. Additionally, to help ensure accessibility to students of all technical levels and socio-economic backgrounds, SDO’s AI-driven tutor and visualization tools offer 24/7 assistance. The SDO’s modular course design enables educators to leverage a customizable curriculum by reusing existing modules and creating new ones. The train-the-trainer program provides educators with tools to implement instructional design best practices to effectively help students develop career-ready skills (see Career Readiness in Fig. 1).
Based on the barriers reported by learners that made precision medicine education inaccessible for them (Supplementary Table 1), SDO offers low and middle income learners from all 50 states in the U.S. and 92 countries globally cost-free access to the Stanford Genetics certification in Bioinformatics and AI/ML. Low and middle income learners with free access make up 90.2% of SDO’s total learners population. Women make up 32.6%, projecting a positive long-term impact on the entire household’s education, healthcare, and income61,62. Post-certification, students are prepared to take responsibility for further study and continuous learning to sustain and grow their knowledge in the rapidly evolving field of continuous medicine.
Learning outcome and satisfaction
We evaluated students’ learning outcomes and program satisfaction by measuring certificate completion rate, students’ self-efficacy, and perceived program impact.
The overall SDO Bioinformatics programs completion rate is 50.5%, and for structured cohort programs, it is 85.7%, both exceeding the Massive Open Online Courses (MOOCs) at 7%-10%63,64,65. In addition, certified students are required to achieve above 80% answer accuracy on formative assessment in quiz format following each learning module and 75% accuracy on the certificate exam following completion of all learning modules.
We measure self-efficacy by comparing students’ 1–5 Likert scale confidence ratings before and after each learning module on how much they agree they can achieve the module’s learning goals (see Supplementary Data 2). A significant growth in confidence ratings is observed across all learning modules, especially in Cloud Computing and Bioinformatics for learners from broad academic backgrounds (Supplementary Table 3 and 4). Among 1,495 learners, ratings of moderately confident and above increased by 33.9% to 97.6% for Cloud Computing and 47.8% to 96.1% for Bioinformatics (Fig. 2). High academic self-efficacy in Science, Technology, Engineering, and Mathematics (STEM) is strongly associated with forming a science identity, taking more science courses, pursuing a science career, and predicting academic achievements66,67,68,69.

The confidence level on a sample of 1,495 learners on their competence regarding each learning topic were reported in surveys before and after they completed the Bioinformatics certificate program. The figure shows the noticeable increase in confidence in Cloud Computing and Bioinformatics topics (see Supplementary Table 3 and 4 for learners’ backgrounds). In the figure, light blue indicates the number of ratings that the learners are not confident at comprehending the key concepts in the learning modules; blue denotes the number of ratings that the learners are slightly confident at comprehending the key concepts in the learning modules; light green represents moderately confident; green represents very confident; dark green represents extremely confident.
Aligning with high self-efficacy’s career impact described in literature66,67,68,69, a survey of 72 certified respondents demonstrated high satisfaction. The program’s positive impact was reported at 97.5%, including 22.8% believing the programs positively impacted them securing internships or jobs, 27.8% developing interest to continue pursuing precision medicine, and 46.9% gaining confidence to apply for academic or professional opportunities. Additionally, we found 93.8% of certified learners wanted continued SDO involvement, either taking another course or teaching/ mentoring others. A total of 84.7% of certified learners recommended the program to others (Supplementary Data 1).
AI tutor
We built an LLMs-powered AI Tutor on SDO that democratizes private tutoring for students who cannot afford or allocate time for traditional methods, benefiting economically disadvantaged and underrepresented groups by providing an accessible and high-quality educational support. This AI Tutor (see Supplementary Fig. 1b) specializes in questions pertinent to bioinformatics. It receives student inquiries, applies embedding techniques to identify the most relevant content within SDO, and uses prompt engineering to generate pertinent responses. In order to mitigate misinformation, the AI Tutor pulls answers from all the learning module content created and pre-vetted by Stanford scientists. For each AI Tutor generated answer, AI Tutor provides the source as SDO or LLM (see Supplementary Fig. 1b). Learners can also clarify with or provide feedback to our teaching team during live office hours if they feel uncertain about the answers given by AI Tutor.
Every interaction is scrutinized under multiple layers of guardrails to ensure the accuracy of the information, prevent the generation of erroneous or misleading content (hallucinations), and maintain relevance to the field of bioinformatics. We have observed that hallucinations often occur when the system is asked to generate responses without sufficient context (e.g., The following question without the figure lacks context: Answer this question based on Fig. 1 in Module 3.). In such cases, our guardrails prompt for clarification to ensure accurate and contextually appropriate answers. Similarly, if learners ask questions that lack context or fall outside the relevant bioinformatics domains, the AI Tutor will indicate that it does not understand the question and prompt learners to send another inquiries that are related to bioinformatics or its associated fields (e.g., statistics, machine learning, AI, genomics, etc.).
Evaluating AI tutor’s performance
We evaluated the AI Tutor’s performance in three key areas: (1) response accuracy, based on its answers to 246 bioinformatics questions created by the SDO team; (2) guardrails performance, assessed through 2081 student-submitted questions; and (3) AI Tutor’s Use Cases and Perceived Usefulness.
Response accuracy
We compared 10 LLMs’ responses to 246 SDO-team-constructed bioinformatics multiple-choice questions with our answer keys. Figure 3 shows the performance of different LLMs: Claude 242, Claude 3 Haiku43, Claude 3 Opus44, Claude 3 Sonnet45, Gemini 1.5 pro46, GPT-3.547, GPT-4, GPT-4 Turbo48, GPT4o49, Llama250. Initially, there were 298 questions, but 20 ambiguous questions flagged by the majority of the LLMs were removed.

a Accuracy to General questions (n = 246, excluding ambiguous and context-specific questions). This figure shows the accuracy of AI Tutor’s answers to 246 general questions after removing 20 ambiguous questions and 32 context-aware questions. Across (a–e) purple bars represent Claude models; the green bar represents Gemini model; blue bars indicate GPT models; the yellow bar denotes the Llama model (b) Accuracy to Programming and Technology questions (n = 49, excluding ambiguous and context-specific questions). Displays the performance of LLMs for programming (R, Python, Pandas) and cloud computing questions (49 questions). c Accuracy to Statistics and Visualization questions (n = 129, excluding ambiguous and context-specific questions). This panel illustrates the performance of LLMs for statistics and visualization questions (129 questions). d Accuracy to Research Ethics, Multi-omics, and Wearable Data (n = 68, excluding ambiguous and context-specific questions). This panel depicts the performance of LLMs in answering questions related to research ethics, multi-omics, and wearable data questions (68 questions). e Accuracy to context-specific questions (n = 32). This panel presents the performance of LLMs for context-aware questions (32 questions); the model was expected to either request additional context or indicate that it lacked the necessary context to respond accurately. Responses that failed to acknowledge the need for context were considered incorrect. f Accuracy to questions about Python (n = 12) vs. R (n = 12). comparing the performance of different models for Python (12 questions) vs. R (12 questions), showing some models are biased toward Python and cannot identify the R context well. In this figure, blue represents Python, and red represents R. Bars show mean accuracy across n = 10 independent runs per condition; error bars represent ± 1 SD. g Python (n = 12) (Nov. 2023 vs. June 2024) and (h) R (n = 12) (Nov. 2023 vs. June 2024). Panels (g) and (h) compare performance of GPT-3.5-turbo, GPT-4, and Claude 2 for Python (12 questions) and R (12 questions): November 2023 vs. June 2024 (with and without guardrail). Unlike in (a–f) where we used the bare LLM (Execution Engine), for G and H, we employed the AI Chatbot (see Supplementary Fig. 1b). Both the Execution Engine and the Guardrail utilized the same LLM. There are variations in performance in how these models differentiate between Python and R coding questions. Claude 2 showed significant improvement in handling R/Python questions. Similar findings are reported in recent studies88. Another observation concerns guardrails: GPT-3.5 flagged 5 out of 12 Python questions and 4 out of 12 R questions as irrelevant. It is important to consider while designing guardrails—none of the questions were flagged by GPT-4 as irrelevant in 2023 or 2024. The closed-source nature of some LLMs raises concerns about predictability and interpretability, particularly in medicine, where decision-making is paramount. For both Fig. 3g, h, blue represents the AI Tutor we used in November 2023 with guardrail; orange represents the AI Tutor we used in June 2024 with guardrail; green represents the AI Tutor we used in June 2024 without guardrail for this particular experiment while AI tutor in production is equipped by guardrails.
In our study, we grouped general questions into three categories as depicted in Fig. 1: Programming and Technology; Statistics (including Visualization and AI/ML); and Data (covering Multi-omics and Wearables). We conducted a detailed analysis of various LLMs’ performances across these categories, as shown in Fig. 3a–d, evaluating them on general and domain-specific multiple-choice questions relevant to bioinformatics topics for 10 times in June 2024 (Supplementary Data 3). To evaluate the risk of LLMs giving erroneous answers without sufficient context, we compared the LLMs’ accuracy of 32 questions (i.e., context-aware questions) that refer to specific information inaccessible to the LLMs, such as an image, a code block, or a research study (Fig. 3e). In healthcare applications, when a model attempts to interpret missing data that a physician failed to provide without acknowledging it (i.e., hallucinating), the LLM-generated information could lead to significant health and financial cost. We also examined the models’ differential responses to Python and R programming questions, noting a tendency in some LLMs to favor Python, which often leads to mistakes in R contexts (Fig. 3f). This bias was further analyzed in Fig. 3g, h, comparing the performance of models such as GPT-4, GPT-3.5-turbo, and Claude 2 over two periods, November 2023 and June 2024.
The findings from our figures indicate that overall, the GPT-4 family generally outperforms other models across most question categories (Fig. 3a–d). GPT-4o achieved the highest accuracy in General questions as well as Programming and Technology questions (Fig. 3a, b), whereas GPT-4-turbo excelled in Statistics and Visualization questions, as well as Research Ethics, Multi-omics, and Wearable Data questions (Fig. 3c, d). The Claude 3 family also performed strongly, particularly Claude 3 (Opus), which shows high accuracy in multiple categories. However, GPT-3.5-turbo performed poorly on context-specific questions (Fig. 3e), indicating significant limitations in handling queries that require specific contextual understanding. The comparison of Python vs. R responses (Fig. 3f) reveals a notable bias towards Python, with some models performing significantly better in Python than in R. Furthermore, the radar charts (Fig. 3g, h) illustrate the improvements or regressions in model performance over time, with Claude 2 showing notable improvements in handling guardrail scenarios in June 2024 compared to November 2023.
Evaluating AI tutor’s guardrail performance
We implemented the AI Tutor using GPT-4 in production as the default LLM, although learners can switch to other LLMs via the user interface. To ensure the AI Tutor responds only to questions related to the educational content in SDO, we built several guardrails (see Supplementary Fig. 1b). Given that LLMs are constantly evolving, which could result in unpredictable AI Tutor responses, we set constrained guardrails to mitigate risks while ensuring the AI Tutor can effectively support learning activities.
The performance of the 2082 AI Tutor responses to students’ questions demonstrated its ability to adhere to the guardrails (Supplementary Table 2). The guardrail’s precision was calculated at 100%, indicating no false positives among the predicted positives. Recall, or sensitivity, was 93.4%, reflecting that most positive cases were correctly identified. Specificity was 100%, meaning all true negatives were accurately recognized. Additionally, the F1 score, the harmonic mean of precision and recall, was 96.6%, providing a balanced measure of the model’s accuracy in identifying both classes. Notably, there were 126 false negatives, indicating missed SDO-content-related questions. These metrics indicate AI Tutor is capable of providing correct and relevant answers to students, cultivating trustworthy interactions with students.
Evaluating AI tutor’s use cases and perceived usefulness
SDO’s blended learning model effectively combines self-paced modules with interactive AI-facilitated learning activities, enhancing educational engagement and outcomes. Students utilizing this hybrid approach not only benefit from the flexibility of independent study but also gain substantial support through structured digital interactions, as shown by multiple studies70,71. This methodology particularly benefits underprivileged students, offering frequent opportunities to interact with AI tools, which is critical for developing AI literacy. LLM applications have demonstrated creativity surpassing 99% of people in originality and fluency. GitHub Copilot sped up coding tasks by 55.8%. Proficiency in AI tools not only boosts learners’ project and career prospects in precision medicine but also enables learners to become efficient collaborators in research and reduces training periods in professional settings72,73,74.
Figure 4a shows that 46.7% of the most queried topics include Programming and Cloud Computing, while 21.2% cover Statistics, Visualization, AI/ML, and 20.3% relate to Bioinformatics/Omics-data. As for the types of questions, Fig. 4b indicates that 39.5% of the inquiries involve clarifying or troubleshooting code, 18.2% ask about a quiz or exam, 13.8% are statistics questions, and 11.8% are bioinformatics questions.

a Learners’ Questions Categorized by Learning Modules Topics (n = 2,082). A total of 2,082 questions from 156 learners categorized by learning modules topics (Supplementary Data 4). 43.9% of the questions are about Programmings, followed by 16.1% Statistics. a(ii) 47.3% of the questions labeled as Irrelevant are questions about Stanford Data Ocean. 19.3% are questions that lack context to identify students’ intentions.In this figure, red color in the figure indicates learner questions related to omics data or wearable data; green denotes learner-generated queries that are irrelevant to bioinformatics (e.g., greetings, expressing gratitude); blue corresponds to questions relevant to Python, R, and Cloud Computing; purple pertaining to to statistics and data visualization. b Learners’ Questions Categorized by Goals (n = 2082). A total of 2,082 questions are categorized by the goal students are trying to accomplish by using AI Tutor. 20.2% are about clarifying programming and technology concepts, and 19.3% are about writing or troubleshooting code. We gave the AI Tutor a persona and described what it is and what it can do (e.g., The prompt: You are a helpful assistant well-versed in bioinformatics and related technologies. Please answer questions with all the needed context related to the Fundamental Modules content multi-omics, statistics, R, Python, etc. If a question pertains to a different topic, politely refuse to answer.) In this figure, turquoise color represents learner-generated questions to the AI Tutor about the SDO platform’s functionalities and user experience; yellow denotes specific questions about learner’s individual projects; purple represents questions related to the SDO’s quiz or exams; red represents questions that are trying to clarify unfamiliar concepts in omics data or wearable data; blue represents questions that are trying to clarify unfamiliar concepts in Python, R, or Cloud Computing; orange represents questions that are trying to clarify unfamiliar concepts in statistics or data visualization; green represents queries that expresses thankfulness to the AI Tutor’s answers; pink marks queries that lacks context; gray indicates questions that ask the AI Tutor to write or explain the code or help them troubleshoot the code that generated errors.
A quantitative evaluation of the AI Tutor’s impact shows high student satisfaction and perceived effectiveness. On the platform, 76.56% of responses were positively rated, and 71.3% of students on a six-point Likert scale strongly agreed that the AI Tutor enhanced their understanding of precision medicine (see Supplementary Data 2). Additionally, 21.3% moderately agreed, and only 6.4% slightly agreed. The AI Tutor excelled in programming and bioinformatics—key areas of precision medicine—with particularly high agreement in technology-related modules such as statistics and cloud computing. These results highlight the AI Tutor’s effectiveness in supporting student learning and identify potential areas for further improvement to optimize user experience.
LLM-based research data visualization
AI tutor for data visualization: fostering algorithmic thinking
Analysis of learner queries in Fig. 4b reveals that 39.5% of learners concentrate their questions on aspects of programming, such as interpreting and troubleshooting code. This observation prompts a new research question emerging directly from the data: Is extensive programming knowledge essential for completing precision medicine tasks? The frequency of programming-related inquiries and the effectiveness of the AI Tutor by learners underscores the need to reevaluate and enhance how educational models integrate programming skills with domain-specific scientific training.
Programming fosters critical thinking and problem-solving skills75 (e.g., through Divide-and-Conquer, Dynamic Programming, Greedy Algorithms, Graph Algorithms, Probabilistic and Analysis, and Randomized Algorithms). However, while error handling builds resilience, persistence, and adaptability, it is time-consuming and detracts from valuable research hours that could be used to unlock biological mechanisms. To address this, SDO’s AI Data Visualization tool prioritizes algorithmic thinking using LLMs—shifting the focus away from memorizing code syntax and time-consuming debugging. This approach helps learners in the life sciences develop higher-order thinking skills, particularly in problem-solving and critical reasoning76,77.
The SDO’s AI Data Visualization tool enables users to import their own biomedical datasets for research analysis. This tool supports multi-modal analysis, accommodates a broader array of data formats, and incorporates automatic error handling, all while being compatible with both Python and R. For more details on this innovative approach, see Methods. The visualization component operates under the assumption of two primary user groups:
-
1.
Non-technical Users: Users with no programming experience or data familiarity use system generated prompts. Here, the platform first summarizes the dataset and leverages LLMs to generate an explanation of the data and potential visualization goals (i.e., prompts); users can then select their desired goal, prompting the system to utilize the LLM output and summary to automatically generate visualization code and produce the corresponding plots. This multi-step process (e.g., data summarization, goal generation, and elaboration, reading user-generated prompt, code creation, error handling, and plot generation) is further detailed in Supplementary Fig. 1c. Users can further explore the data by posing questions, with the platform assisting in code generation and visualization based on the provided query. Figure 5 illustrates the capability of SDO AI-facilitated visualization for autonomous interpretation and visualization of multi-omics and wearable sensor data (Supplementary Data 5).
Fig. 5: Autonomous interpretation and visualization of multi-omics and wearable data through language model integration. 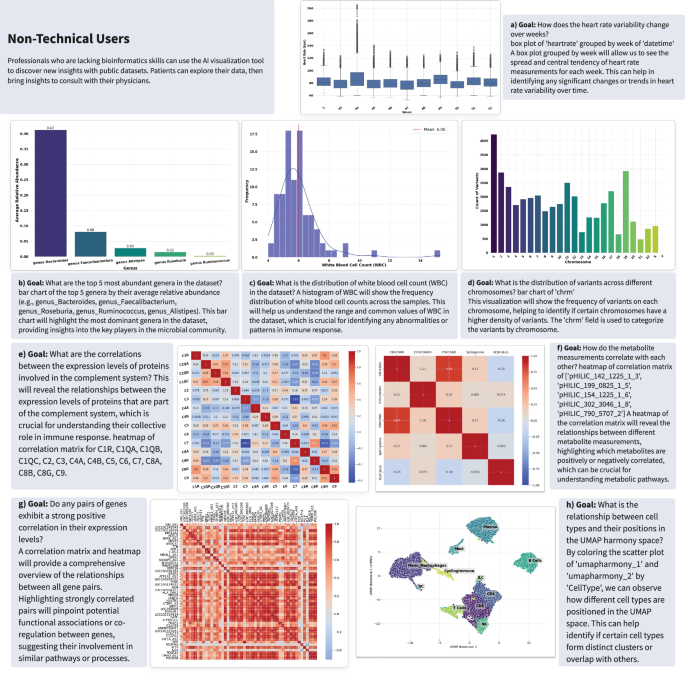
The text boxes represent goals expressed as prompts, generated by GPT-4o based on summary data and metadata from the SDO platform. a Heart Rate Variability Over Time (Wearable data): Box plot showing weekly heart rate variability across different weeks, providing insights into changes in heart rate dynamics over time. b Dominant Bacterial Genera (Gut 16S data): Bar graph illustrating the relative abundance of the top five most abundant bacterial genera in the dataset, highlighting key players in the microbial community. c White Blood Cell Count Distribution (Clinical data): Histogram showing the frequency distribution of white blood cell counts, crucial for identifying abnormal immune response patterns. d Chromosomal Variant Distribution (Genomics data): Bar chart representing the frequency distribution of genetic variants across different chromosomes, useful for identifying potential chromosomal hotspots of variability. e Protein Interaction in Immune Response (Proteomics data): Correlation matrix displaying relationships among protein expression levels involved in the complement system, aiding in understanding their collective roles in immune response. f Metabolite Intensity Correlations (Metabolomics data): Heatmap showing correlations between spectral intensity measurements of metabolites, revealing interactions and dependencies crucial for metabolic studies. g Gene Expression Correlations (Transcriptomics data): Correlation matrix and heatmap analyzing pairwise relationships between gene expression levels across the genome, providing insights into potential regulatory and co-regulatory networks. H. Immune Cell Distribution (snRNA data): UMAP representation of snRNA immune cells colored by cell type, illustrating the relationship between cell types and their positions in the UMAP harmony space. Users can fine-tune the visualization by providing feedback, such as changing the x-axis title. The data used in this demonstration were sourced from four independent studies: Mishra et al.51 (Participant ID: A0NVTRV for Fig. 5a), Zhou et al.52 (Participant ID: ZOZOW1T for Fig. 5b, c, e, f, and g), the 1000 Genomes Project83 annotated by the COSMIC68 dataset84 for Fig. 5d, and snRNA immune cells processed data from Hickey et al.85.
-
2.
Technical Users: Users with an understanding of data analysis but want to save time from low-level programming challenges such as syntax, library management, debugging, and API updates (e.g., physicians, geneticists, or biologists). These users simply input the desired algorithm (see Supplementary Fig. 1c), prompting the system to generate the code and corresponding visualization. It is crucial to note that problem definition and algorithmic thinking—defined as the ability to break down problems into a series of logical steps—are essential elements of this process. Proper problem definition and algorithmic thinking are vital because they guide the AI in generating accurate and relevant code; without these, users may encounter incorrect or inefficient solutions. The AI Tutor supports users by helping them better define their problems and develop algorithmic thinking skills, ensuring the system produces the most appropriate code and visualizations. We showcase the versatility of the SDO platform in addressing various research questions posed by technical users (Fig. 6). Figure 6a–e demonstrate the robustness and versatility of automated code generation for replicating and interpreting complex visualizations across diverse research domains (Supplementary Data 5).
Fig. 6: Automated code generation and execution from natural language inputs for data visualization in multi-omics and wearables research. 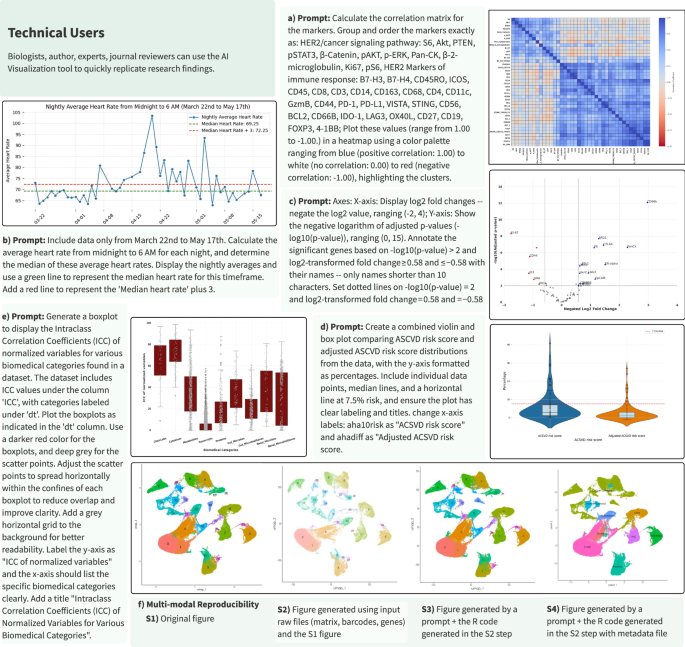
The text boxes represent expert-curated prompts designed to reproduce each figure using public multi-omics and wearable datasets. a Protein Marker Correlation Analysis: Heatmap displaying pairwise correlation coefficients for protein markers involved in pathological complete response (pCR) analysis. This figure replicates and expands upon the heatmap from Fig. 2c in McNamara et al.86, highlighting potential biomarker interactions in cancer pathways. b Heart Rate Analysis for COVID-19 Detection: Line graph depicting daily average resting heart rates from March 22 to May 17th, identifying significant trends that could indicate physiological responses to COVID-19. This visualization is inspired by the NightSignal algorithm and replicates the scenario depicted in Fig. 1b in Alavi et al.39, illustrating variations in resting heart rate during the pandemic. c Differential Protein Expression in Oral Cancer: Volcano plot contrasting protein expression profiles between bacteria-positive and -negative regions in oral squamous cell carcinoma. Adapted from Fig. 2 in Galeano Niño et al.87, this plot aids in understanding micro-niche level variations within tumor environments. d ASCVD Risk Score Distribution Analysis: Combined violin and box plot of atherosclerotic cardiovascular disease (ASCVD) risk scores, comparing standard and adjusted scores across a sample. Based on Fig. 4a in Schössler-Fiorenza Rose et al.53, it facilitates risk assessment and stratification in clinical research. e Variance Analysis in Multi-Omics Data: Boxplot showing the intra-class correlation coefficients for various biomedical categories, indicating variance levels attributed to participant structure. This visualization is based on Fig. 2a in Zhou et al.52, which is crucial for evaluating consistency across multi-omic datasets. f scRNA-seq Data Visualization via UMAP (Uniform Manifold Approximation and Projection): UMAP plot derived from scRNA-seq data files (barcodes.tsv, genes.tsv, matrix.mtx), visualizing gene expression patterns across different cell types. The AI visualization component summarizes all input files and iteratively generates the plot. While the output UMAP in F.S2 is not exactly the same as F.S1, by adding the right set of steps, the SDO AI visualization component successfully captured the clusters in F.S2. The prompt is described as the following: Filter the cells in the Seurat object to include only those with an RNA count of less than 100,000. Normalize the data in the Seurat object using the LogNormalize method, with a scale factor of 10,000. Identify the top 2,000 variable features (genes) in the dataset using the variance-stabilizing transformation (VST) method. F.S4 was built on top of F.S2 and a metadata file. The pipeline in each step provides code and documentation of the thought process it went through to generate the visual. The user can use the documentation to guide the model, where necessary, to achieve the desired outcome (image). This process is iterative.


Reproducibility Feature: Reproducing plots can be challenging due to authors potentially neglecting key parameters such as unclear naming conventions, data/plot inconsistencies, and inadequate data type specifications. Incomplete or unclear documentation on how to install and run code can pose a significant challenge to replication, especially for researchers who may not be well-versed in the necessary tools and package managers78,79. These inconsistencies significantly complicate reproducibility through conventional programming methods. To address this challenge, we have integrated an additional feature within the toolset. Users can provide the target figure and corresponding dataset, prompting the system to leverage LLMs and error handling to reproduce the plot. While successful in many cases, instances of author-specific assumptions (unclear and inconsistent documentation) have rendered figure reproduction nearly impossible despite repeated LLM attempts. Consequently, users must intervene and provide feedback to the LLMs, nudging them to address these issues.
Figure 6f represents an application of single-cell RNA sequencing data visualization. It employs a UMAP technique to visualize data clusters based on the raw files from Wu et al.80. Despite inherent variations due to different computational tools and the stochastic nature of UMAP, SDO effectively captures and displays the main clusters, highlighting its adaptability and accuracy in handling complex genomic data. The platform handles new data types and complex multimodal visualizations.
We propose a potential solution to enhance reproducibility: encouraging authors to provide prompts for future plot generation. This practice could incentivize the explicit communication of implicit assumptions during the visualization process, improving reproducibility.
link


